
Standard 3.MD.B.3 asks 3rd grade students to draw scaled picture graphs and bar graphs, then use them to solve problems asking “how many more” and “how many less.” This collection gathers 3rd grade bar graph and picture graph worksheets and lessons that use real climate and community data to practice those skills. Because these resources target 3.MD.B.3, you can use them alongside the graphing lessons in Illustrative Mathematics, Eureka Math, i-Ready, and Savvas, or wherever graphing falls in your pacing guide.

Students choose a scale, build scaled bar graphs from data they collect, and solve “how many more” and “how many less” problems.


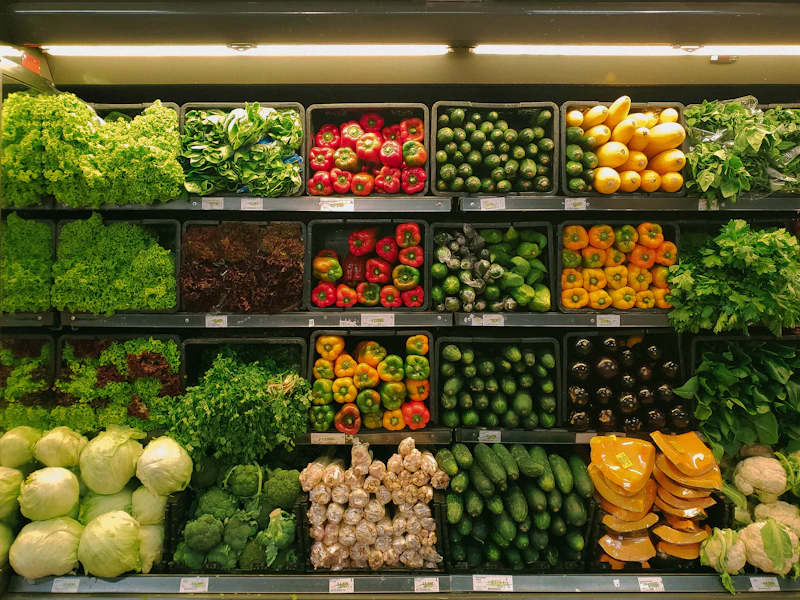
Students represent data with pictures and keys, including pictures that stand for more than one unit.


Students interpret graphs, compare data, and draw conclusions from real measurements.


Keep the momentum going with a simple weekly routine your students will look forward to.
These 3rd grade bar graph and pictograph worksheets give students repeated practice drawing scales, choosing keys, and answering “how many more” and “how many less” questions with data that matters to them.
Once students can build a scaled graph, make it a classroom practice. Post a “question of the week” in your classroom, have students answer with a sticky note or tally, and graph the results together at the end of the week. Students practice choosing a scale with new data every week.
FAQ
Detailed answers, common misconceptions, and sources for teachers planning a graphing unit.
Start with a question your students care about, with a few fixed answer choices, such as “Which recess game do you like best: tag, soccer, or jump rope?” Model the full cycle: ask the question, record answers with tally marks, organize them in a frequency table, then graph. Most 3rd grade data is categorical (counts in groups). The exception is line plots, which show measurement data along a number line.
Watch for these misconceptions:
For IEP and below-grade-level students: Go concrete first. Have students sort real objects or stack linking cubes by category before using tallies. Give them a pre-made tally sheet with the categories already labeled. This follows the concrete-representational-abstract (CRA) sequence, an evidence-based practice in mathematics for students with learning disabilities. Most CRA research focuses on computation, not graphing specifically.
Source: LD@school: The CRA Approach
In Common Core states:
States that don't use Common Core have their own codes.
Sources: Illustrative Mathematics: 3.MD.B standards listing · Common Core State Standards: Grade 3 Measurement & Data · Progressions documents for the Common Core, including Measurement & Data (data part), K–5
Yes, and it often works well. NGSS 3-ESS2-1 asks students to represent data in tables and graphical displays to describe typical weather conditions expected during a particular season. That pairs directly with 3.MD.B.3, which NGSS lists as a Common Core math connection for this standard.
A few cautions:
Sources: NGSS 3-ESS2-1 (official) · The Wonder of Science: 3-ESS2-1 (includes Common Core math connections)
Curricula place graphing very differently, so check where yours puts it:
Use outside resources for:
Match the vocabulary your curriculum uses (“key” vs. “legend,” “picture graph” vs. “picture graph”) so students don't learn two names for one thing. IM, for example, uses “picture graph” and defines the key as the part of a picture graph that tells what each picture represents.
Sources: IM Grade 3 scope and sequence · IM Grade 3 Unit 1 glossary · Eureka Math² lesson list (Amplify crosswalk)
Teach a consistent routine:
Watch for these misconceptions:
For IEP and below-grade-level students: Start with graphs that count by 1, then move to a scale of 2. Highlight the scale numbers. Use a ruler every time.
Source: lead4ward Grade 2 Data Analysis field guide (lists misrepresenting data on scaled bar graphs as a common error)
A picture graph, also called a pictograph, uses pictures (or symbols) to show data. The key tells you how much each symbol is worth. In 3rd grade, one symbol usually stands for more than one item, such as one star = 2 students. Illustrative Mathematics defines a scaled picture graph as a picture graph where each picture represents an amount other than 1.
To read one: check the key, then skip count by that number for each symbol in the row.
Watch for these misconceptions:
For IEP and below-grade-level students: Start with a key where each picture equals 1, then move to 2. Give students a key strip to place beside each row.
Source: IM Grade 3 Unit 1 glossary
It's a bar graph where each gridline on the scale counts by a number other than 1, such as 2, 5, or 10. Illustrative Mathematics defines it as a bar graph marked in multiples of some number other than 1. Scaled graphs make large numbers fit on a page, and they are the main new graphing skill in 3rd grade.
The best way to teach it: graph the same data twice, once with a scale of 1 and once with a scale of 2 or 5. Then ask, “What changed? What stayed the same?” Students see that the values didn't change; only the way they're displayed did. IM uses a similar approach, with a lesson activity where students compare two bar graphs before creating a scaled one.
Watch for these misconceptions:
For IEP and below-grade-level students: Pre-label the scale for them. Start with a scale of 1 or 2, then move to 5 and 10. This matches IM's sequence, which moves from single-unit scales in grade 2 to scales of 2, 5, and 10 in grade 3.
Sources: IM Grade 3 Unit 1 glossary · IM Grade 3 scope and sequence
TEACHER AUTHORS
 Joan NewkirkBiking for Good: Math LessonJoan Newkirk (she/her) is a retired elementary educator with 32 years of teaching experience. She holds a Master of Literacy from the University of Southern Maine and spent her career inspiring young learners through engaging, hands-on instruction across all elementary subjects.View profile →
 Emily TownsendWeather and Climate Graphing Lesson; Math Lesson: Sea Level RiseEmily Townsend is an educator with 15 years of teaching experience as both a general education teacher and an English Language Arts (ELA) specialist. She holds a Bachelor of Arts in Elementary Education from Drake University and a Master of Arts in Teaching, Leadership, and Cultural Competency from the University of Iowa.View profile →
 Sheena Carmela JulianoWeather and Climate Graphing LessonSheena Carmela Juliano holds a Master of Education in Curriculum Studies from the University of Hawai‘i. She has been teaching since 2020 and specializes in science, social studies, English language arts, mathematics, visual and performing arts, health, and engineering for fourth-grade students. She holds Special Education and English as a Second Language certifications.View profile →
 Ember BrockWeather and Climate Graphing LessonEmber Brock teaches reading, writing, mathematics, art, music, science, and computer science to students in grades K-6 in Honolulu, Hawai‘i. They specialize in Elementary Career and Technical Education, with an emphasis on music and robotics, and are passionate about creating engaging, hands-on learning experiences. As a lifelong resident of Hawai‘i, Ember enjoys developing lessons that celebrate the unique culture, history, and environment of the islands while inspiring students to explore creativity, technology, and problem-solving.View profile →
Get new climate education resources, lesson plans, and teaching ideas delivered to your inbox.