Free Math Resources for Teachers 9-12

Explore this Guide
Explore real-world math problems with SubjectToClimate’s wide array of classroom resources. Whether you are looking for STEM classroom activities or free lessons that cover common core standards, SubjectToClimate will be there for you! From using math concepts to investigate climate change impacts to applying problem-solving skills to understand fire progression, these high school resources offer dynamic ways to acquire grade-level mathematical skills.
Key takeaway: Nine free 9-12 resources — geometry and data lessons by teachers, statistics activities, and climate games and labs — covering geometry, data analysis, and statistics.
By Teachers, For Teachers
Help students enhance their geometry and data analysis skills through these standards-aligned lesson plans by educators Nicholas Amendolare and Yen-Yen Chiu.

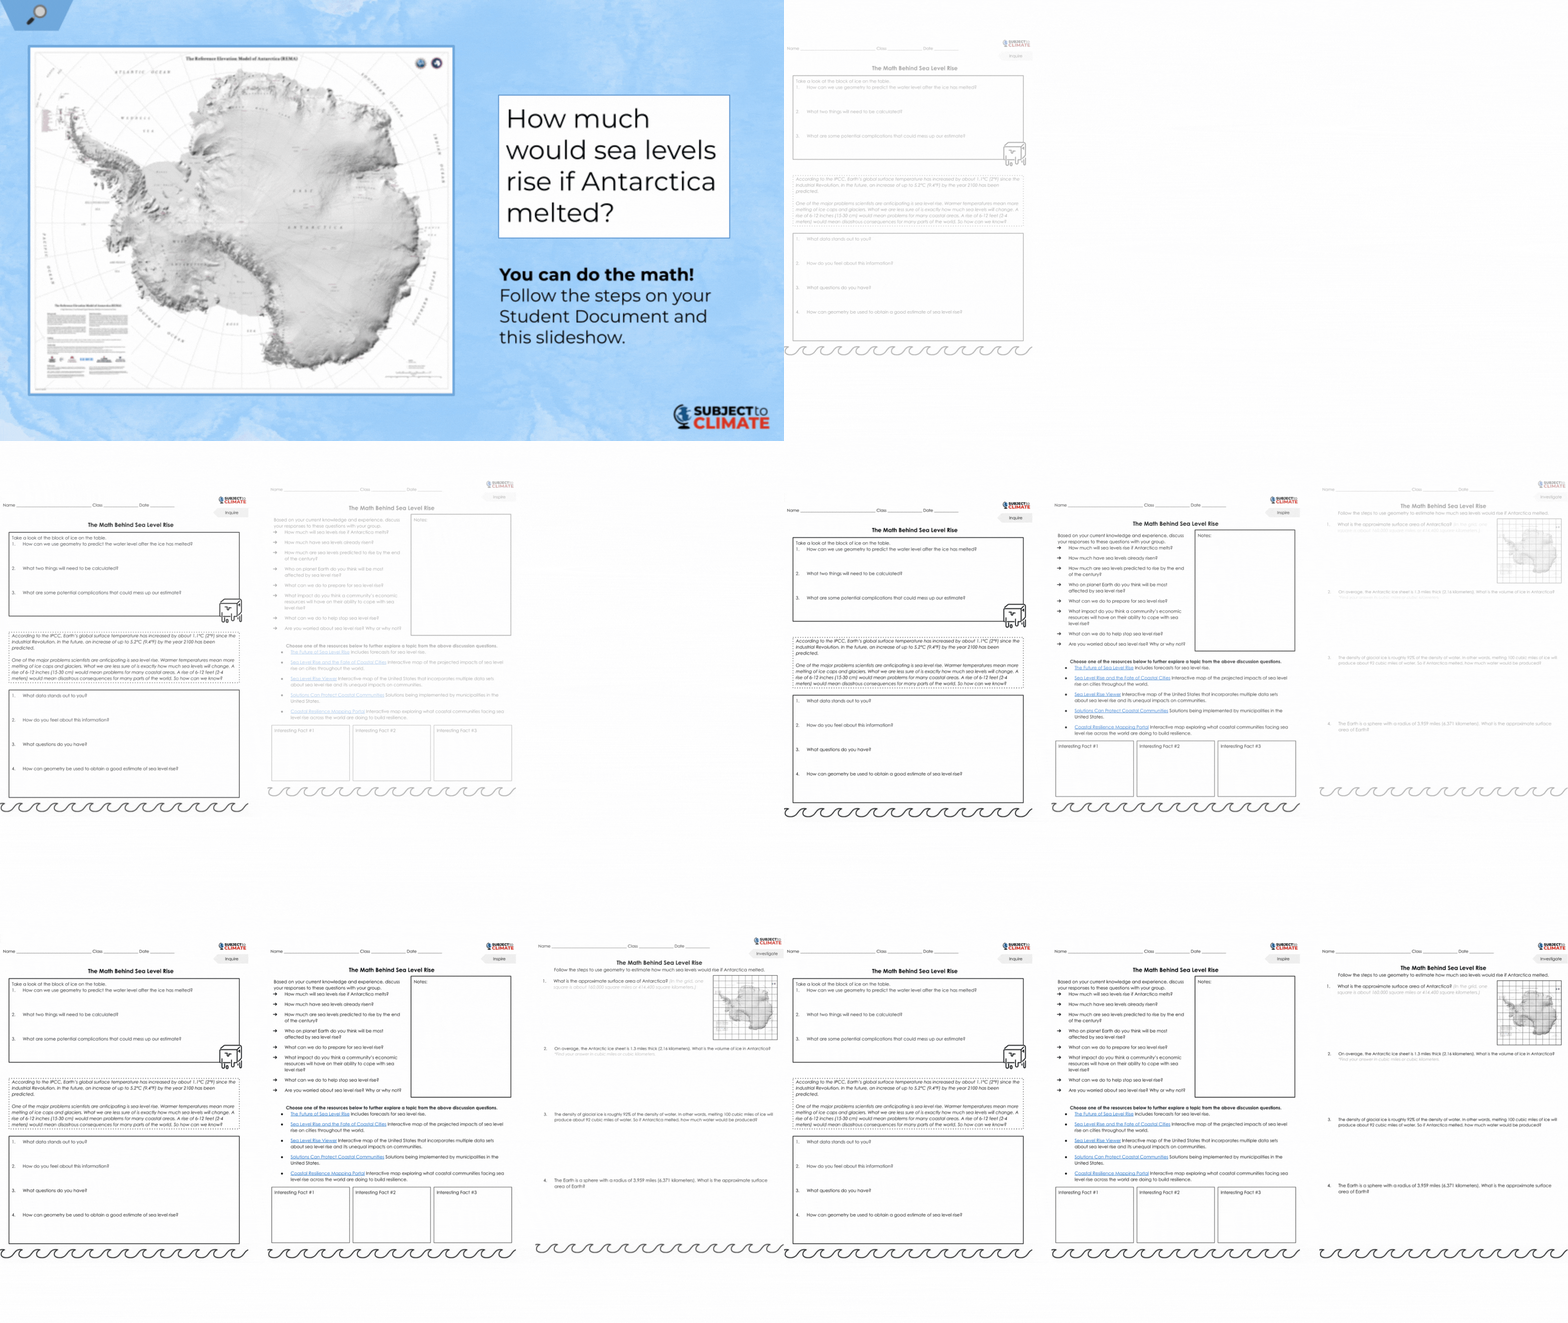
The Math Behind Sea Level Rise
In this lesson, students use geometry to investigate how the melting of all the ice in Antarctica would impact sea level rise. Click on the profile photo to learn more about educator and creator, Nicholas Amendolare.
View Lesson Plan ➜

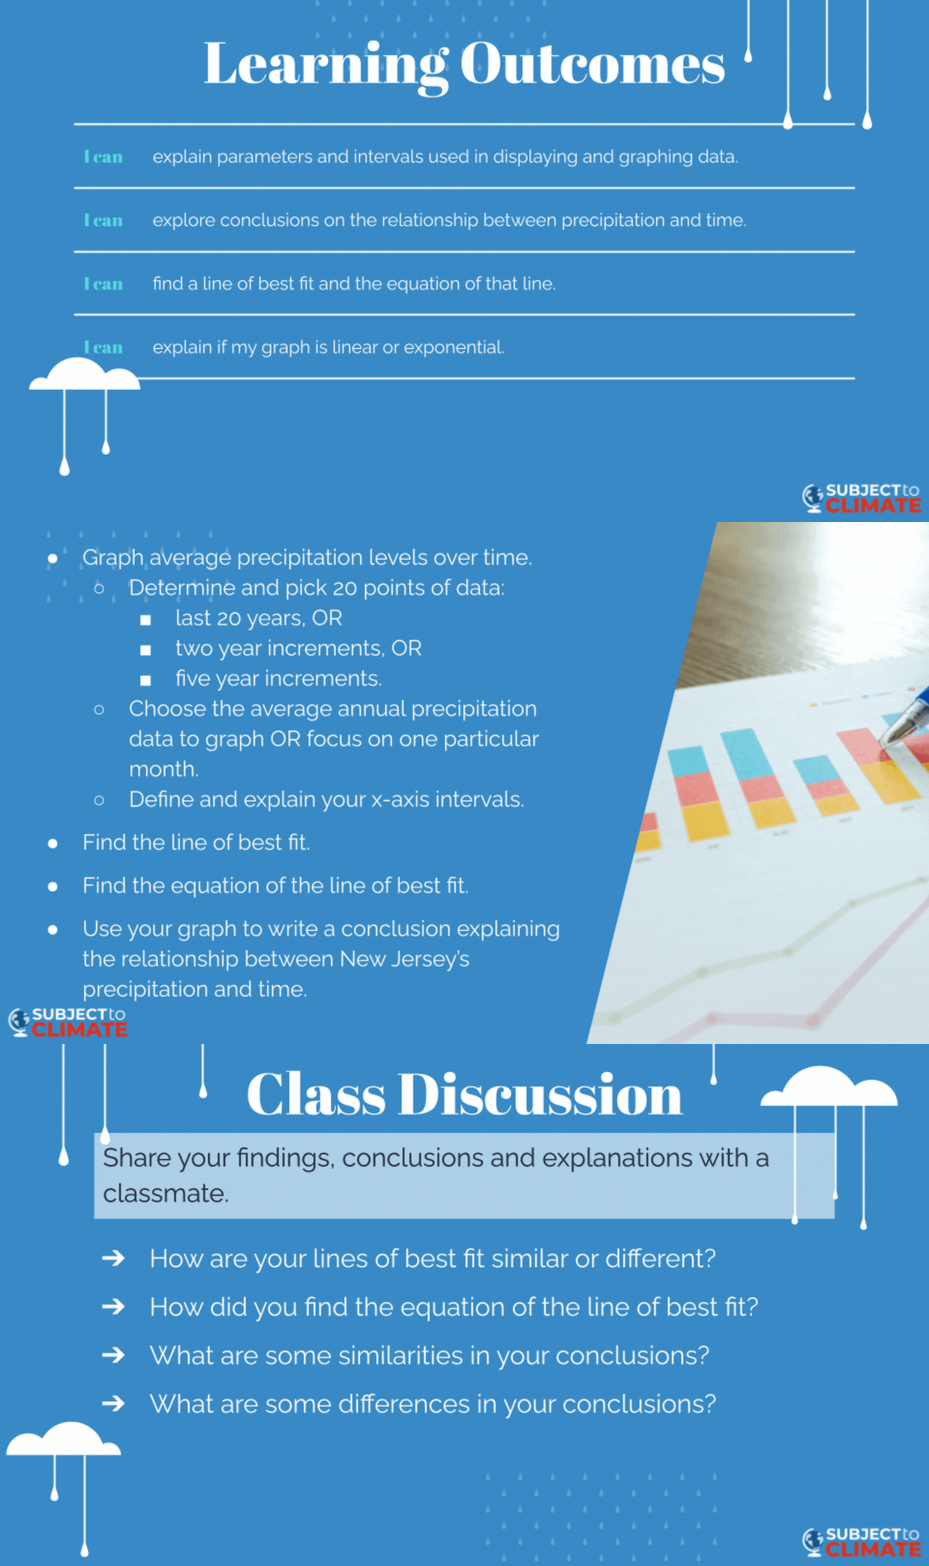
Precipitation Data: What Does It Show?
In this lesson, students use New Jersey precipitation data to create graphs and discuss climate change. Click on the profile photo to learn more about educator and creator, Yen-Yen Chiu.
View Lesson Plan ➜
Lesson Plans & Units
Explore data models, geometry, and statistics through these engaging lesson plans developed to expand students' climate awareness.
Engaging Games & Activities
Students will learn about key climate topics while honing their math skills in these exciting games and activities.
Global Air Temperature Graph
In this math game, students analyze a graph showing air temperature changes over time and identify trends.
View Game ➜
Next Steps
🧮 Math Homepage
View Home ➜📐 Math 3-5
View Guide ➜📊 Math 6-8
View Guide ➜📈 Math 9-12
View Guide ➜✉️ Want a new classroom-ready math resource each month? Get our free newsletter.
Frequently asked questions
What geometry lessons open this guide?
Geometry Lesson: Calculating Sea Level Rise by Nicholas Amendolare (grades 9-12): students use volume and surface area formulas to investigate how melting Antarctic ice would raise sea levels. Graphing Lesson: Precipitation Data by Yen-Yen Chiu (grades 9-12): students graph New Jersey precipitation data, find the line of best fit, and discuss climate change.
Which activities teach data and statistics?
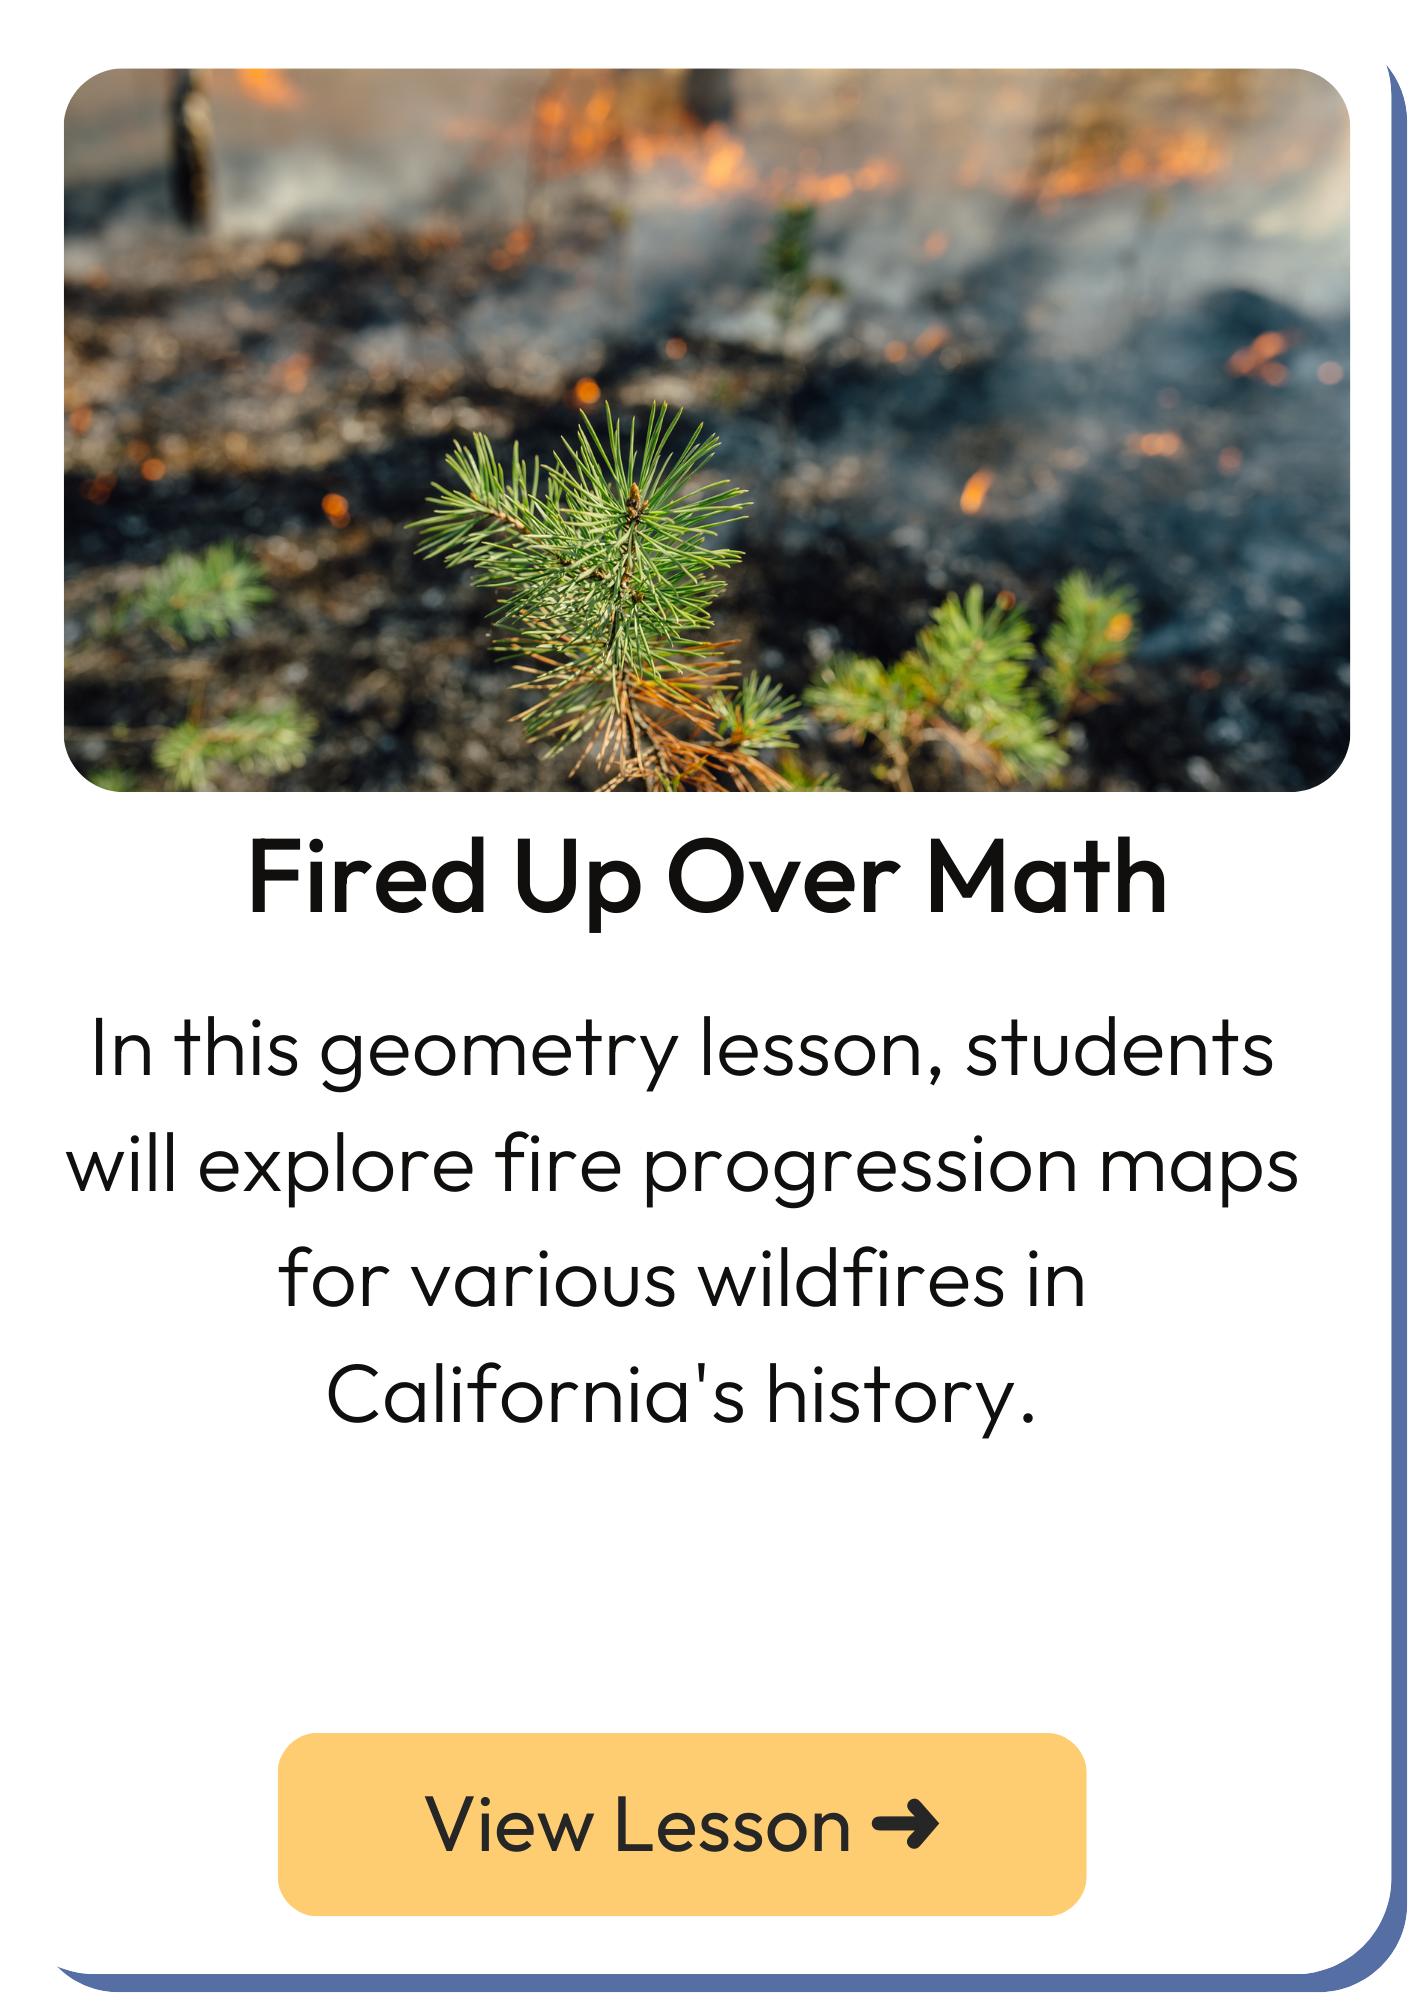
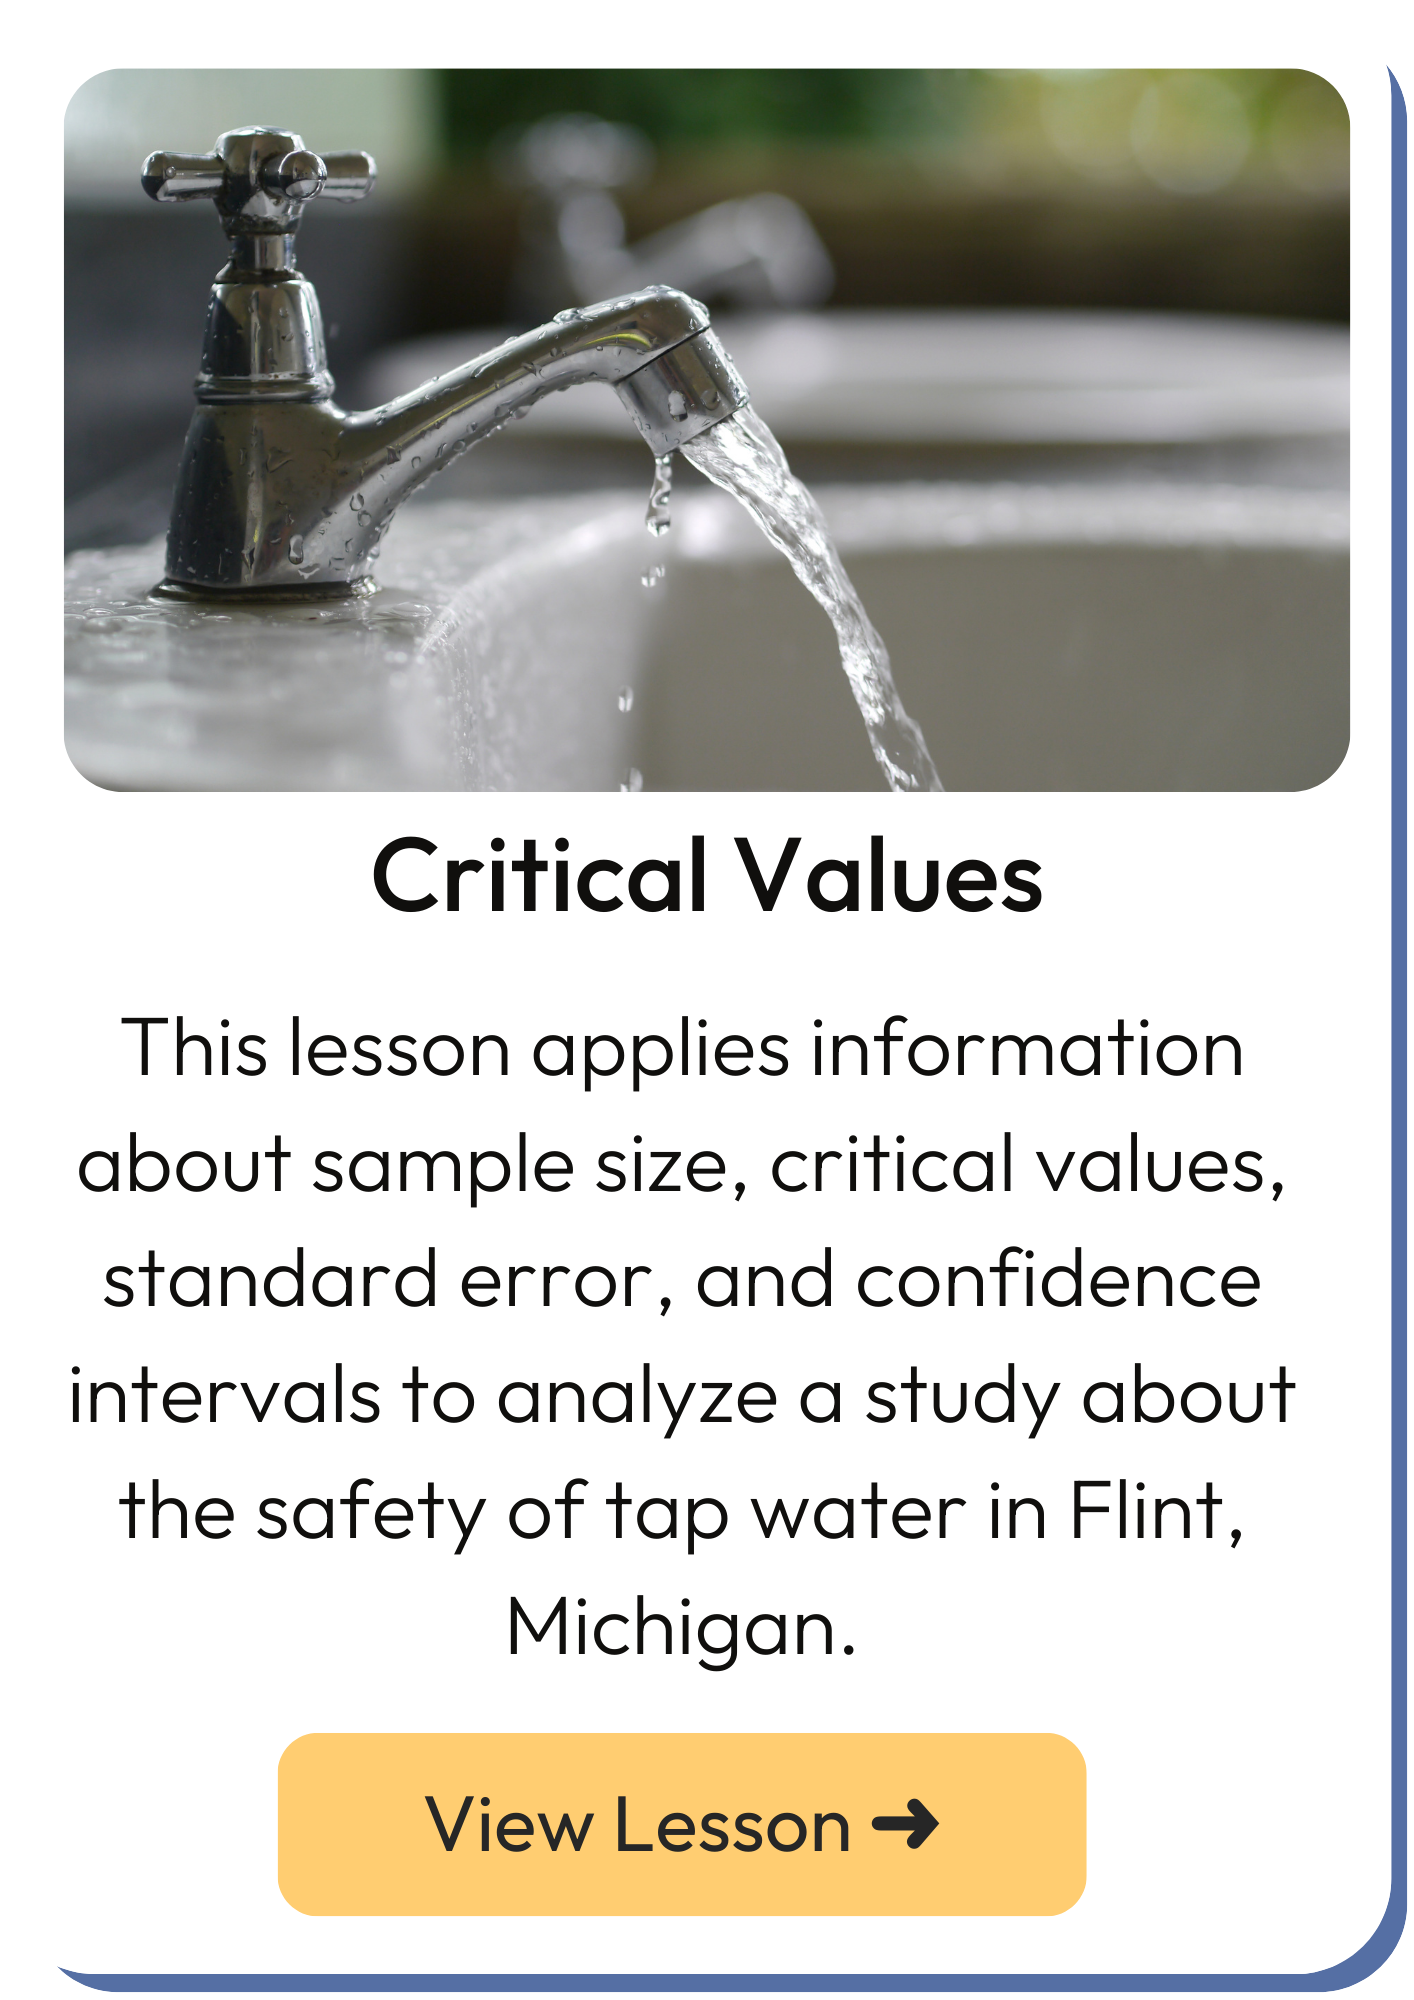
Data Puzzle: The Tipping Point, Fired Up Over Math: Studying Wildfires From Space (NASA fire progression maps and area math), and Critical Values and Margins of Error (Skew the Script statistics on the Flint water study) -- covering data models, geometry, and statistics.
What games and labs build math skills?
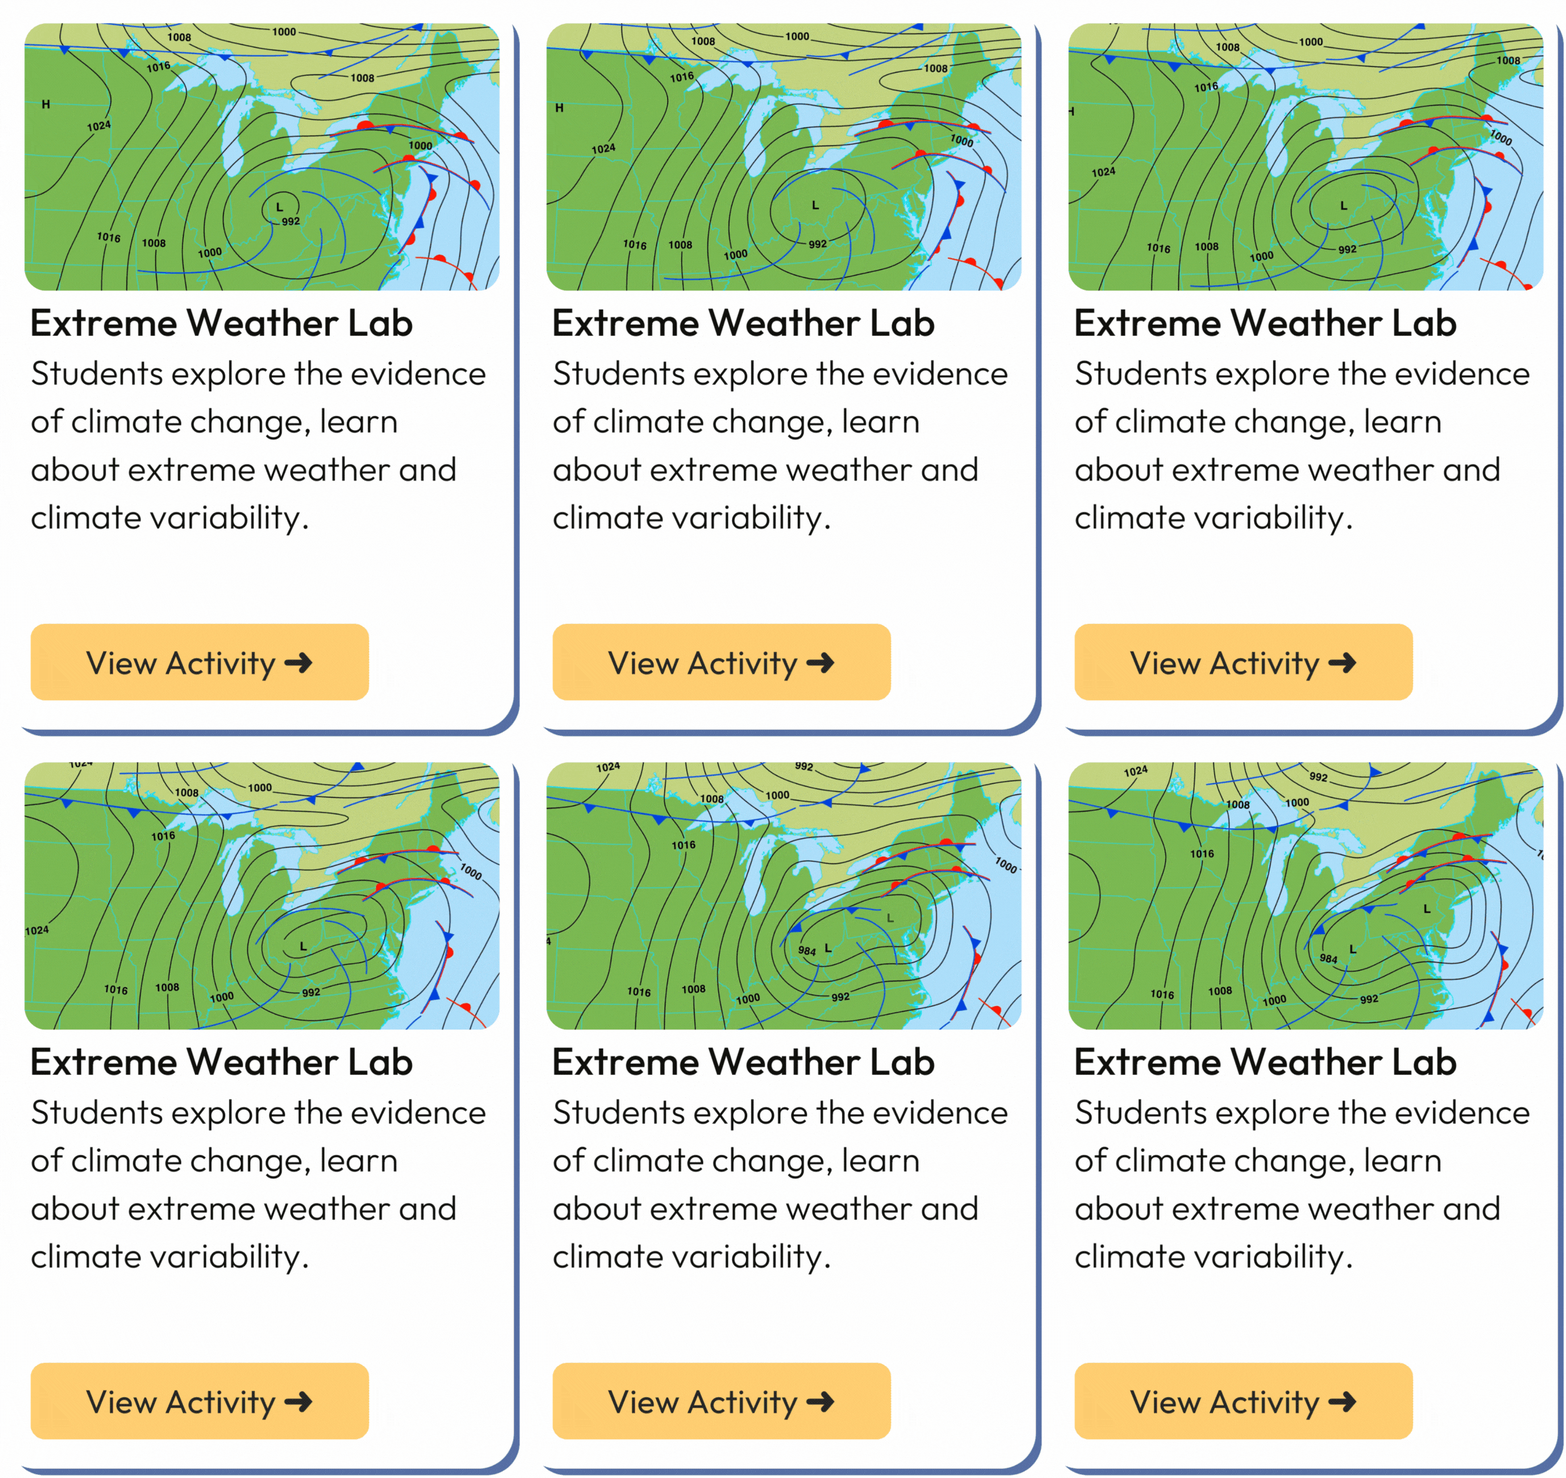
Global Air Temperature Graph (analyze air temperature trends), Extreme Weather Lab (TERC digital lab with climate models), Solar Structures (engineer passive-solar buildings), and Explore Climate Change (Climate Reanalyzer data, graphs, and maps).
Who created the teacher lessons?
Nicholas Amendolare (sea level rise geometry lesson) and Yen-Yen Chiu (precipitation data graphing lesson) -- with links to their SubjectToClimate profiles in the author section below.
Are these resources really free, and are they standards-aligned?
Yes to both. All nine resources are free for educational use with proper attribution, and the guide is built from Common Core-compliant, scientist-reviewed SubjectToClimate resources.
About the authors
Meet the educators behind the featured resources in this guide.
Nicholas Amendolare
6-12 Science, Writing, and PBL Teacher with a Master's in Education from Harvard GSE and 9 years of experience; writer of science content for Study.com and TED-Ed. Creator of the Geometry Lesson: Calculating Sea Level Rise.
View Profile ➜
Yen-Yen Chiu
SubjectToClimate's Director of Education (Ed.D.) with 22 years of public school teaching in ELA, Mathematics, and Music. Creator of the Graphing Lesson: Precipitation Data.
View Profile ➜