Inquiry-Based Math Lesson Plans

Explore this Guide
When you think about teaching climate change, do you immediately think of science lessons? Climate change touches nearly every aspect of life on Earth — so it belongs in every subject, including math. These ten inquiry-based lessons help students see that math is integral to solving the climate crisis: sharing finite resources fairly, decoding air-pollution data, interpreting survey results, and calculating sea level rise from melting glaciers.
Key takeaway: Ten free K–12 math lessons where students divide goldfish, graph forests, map Chicago data, and model sea level rise.
Find Lessons for Your Grade Band
Tap a grade band to filter the ten lessons below.
Showing 10 of 10 lessons
10 Inquiry-Based Math Lessons
Every lesson pairs a real climate question with the math students need to answer it.

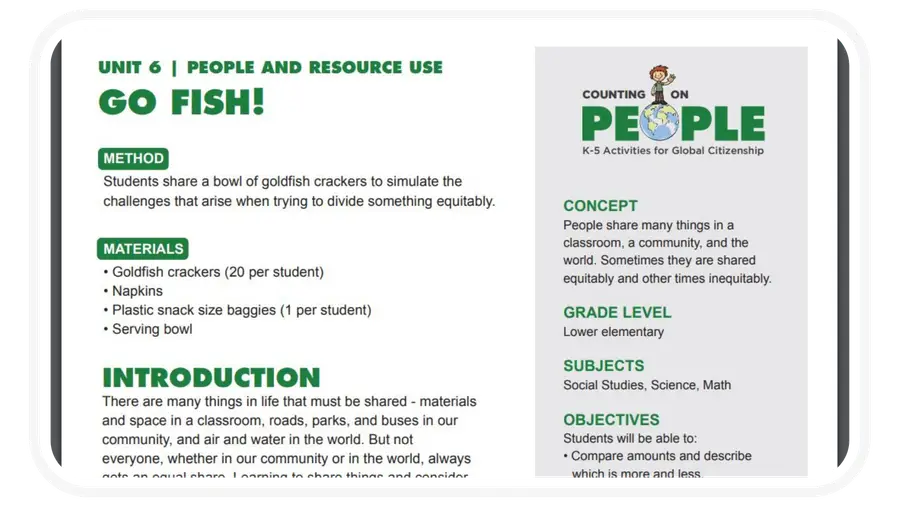
Go Fish!
Grades K–2 · Science · Social Studies · Math · SEL · Lesson Plan · Activity · Video
- INQUIRE: Share a bowl of goldfish crackers and count how many each student takes
- INVESTIGATE: Compare shares with greater-than, less-than, and equal-to skills
- INSPIRE: Build a plan that divides finite resources equally for everyone
How Does Your Garden Grow?
Grades K–2 · Science · Biology · Math · Lesson Plan
- INQUIRE: Explore the schoolyard to find what lives and grows there
- INVESTIGATE: Plant a classroom garden and track growth in a Plant Growth Journal
- INSPIRE: Measure with blocks or rulers and graph plant growth over two weeks
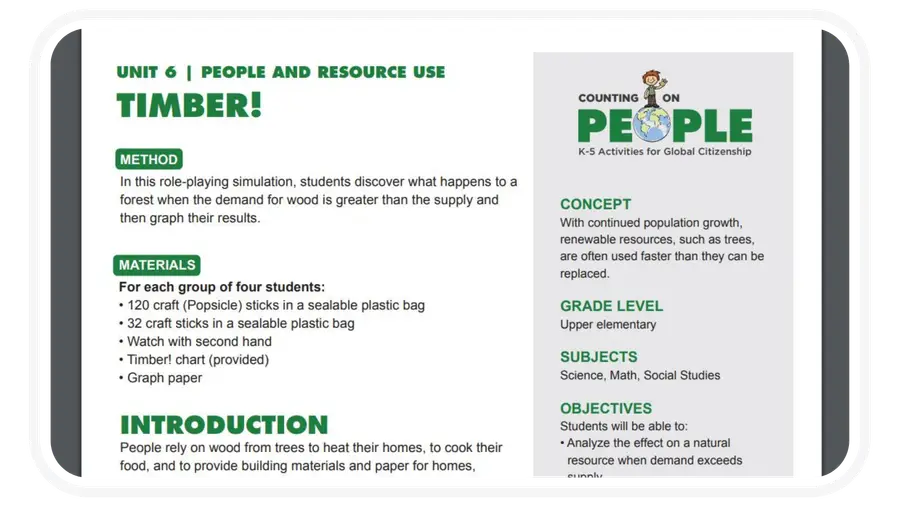
Timber!
Grades 3–8 · Science · Social Studies · Biology · Math · Lesson Plan · Game · Worksheet
- INQUIRE: Play a forestry role-playing game in teams of four
- INVESTIGATE: Record tree data and graph deforestation rates over time
- INSPIRE: Debate supply, demand, and sustainable resource use from the results
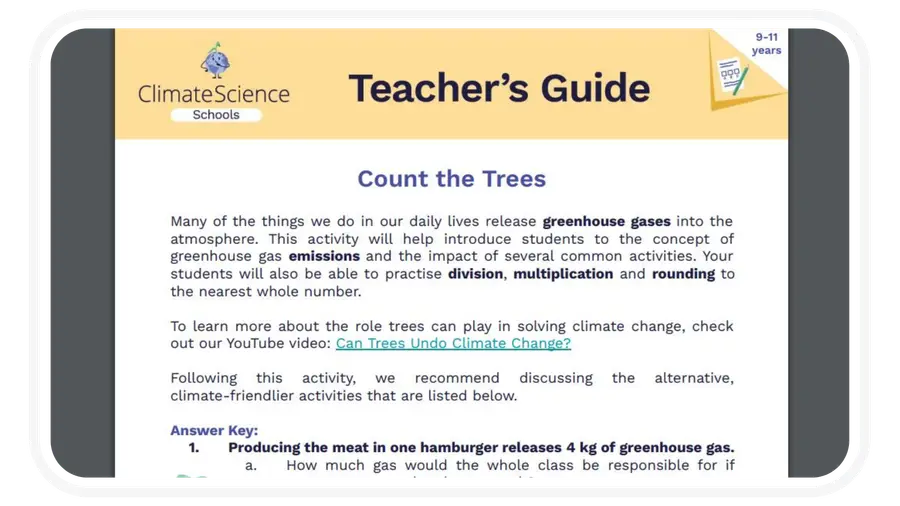
Count the Trees
Grades 3–5 · Science · Biology · Earth & Space · Math · Lesson Plan · Worksheet
- INQUIRE: Solve word problems on emissions from electricity, food, travel, and plastic
- INVESTIGATE: Multiply, divide, and round to find each footprint's tree offset
- INSPIRE: Calculate how many trees to plant to counter personal emissions
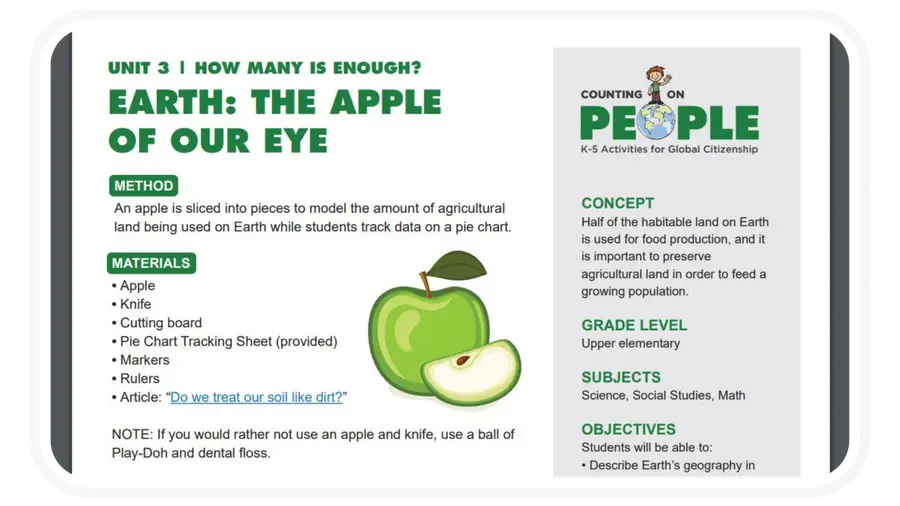
Earth: Apple of Our Eye
Grades 3–5 · Science · Biology · Earth & Space · Math · Lesson Plan · Activity
- INQUIRE: Watch an apple sliced to reveal Earth's tiny fraction of farmable land
- INVESTIGATE: Predict fractions first, then divide a paper Earth to match
- INSPIRE: Halve fractions to model feeding a growing population on less land
Comparing Travel Emissions: Math Lesson
Grades 6–8 · Math · Lesson Plan
- INQUIRE: Watch a climate crisis video and discuss transport emissions
- INVESTIGATE: Calculate miles, cost, time, and CO2e from NYC to six cities
- INSPIRE: Debate routes and pitch ways to decarbonize transportation
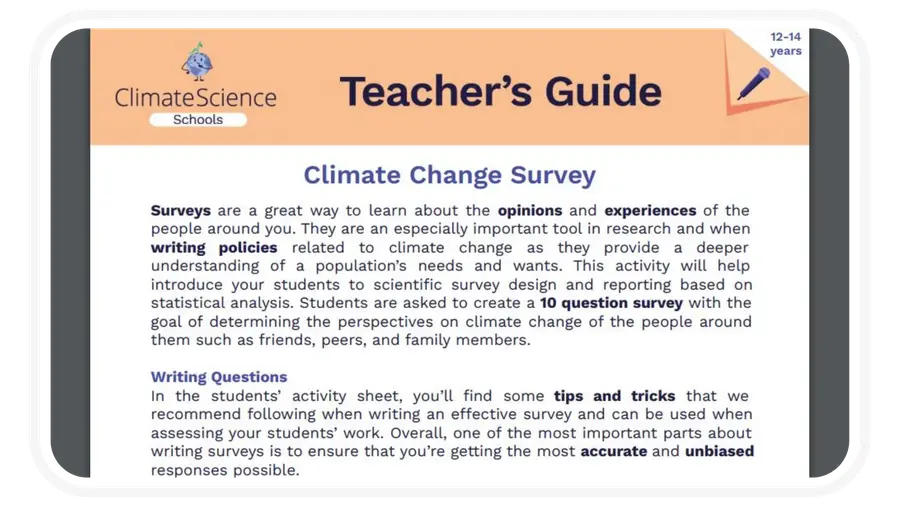
Climate Change Survey
Grades 6–8 · Social Studies · Math · Activity · Lesson Plan · Worksheet
- INQUIRE: Learn unbiased survey design with Likert and ranked-choice questions
- INVESTIGATE: Poll a sample, calculate percentages, and chart the trends
- INSPIRE: Compare results with Yale's Decoding the Data activity

Thermal Expansion & Sea Level Rise
Grades 9–12 · Science · Physics · Math · Video
- INQUIRE: Pause at 0:57 to solve the thermal expansion coefficient equation
- INVESTIGATE: Calculate volume change with the cylinder formula at each interval
- INSPIRE: Graph sea level rise and draw the trend line at 9:04
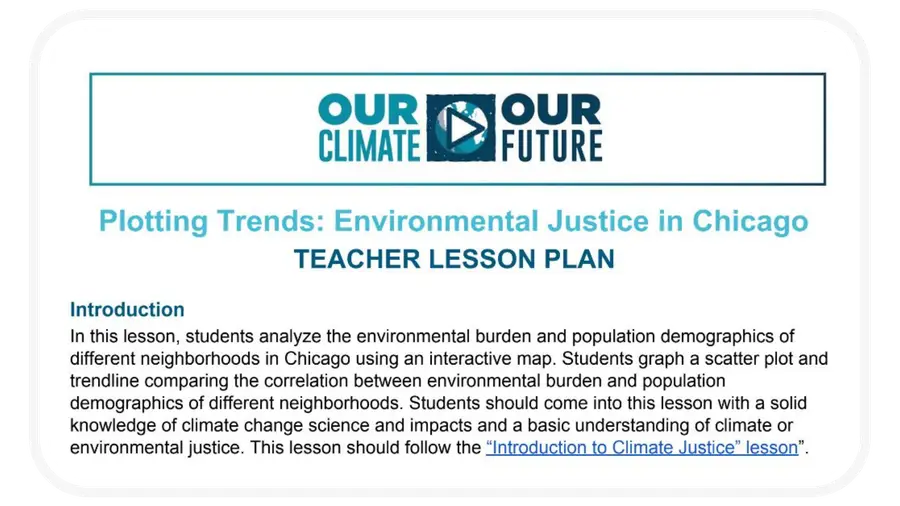
Plotting Trends – Environmental Justice in Chicago
Grades 9–12 · Science · Social Studies · Geography · Math · Justice · Health · Lesson Plan · Interactive Media · Worksheet · Video · Data
- INQUIRE: Explore Chicago's interactive map of population vs. pollution burden
- INVESTIGATE: Record real data and graph scatterplots with trend lines
- INSPIRE: Discuss what the data means for environmental justice in Chicago
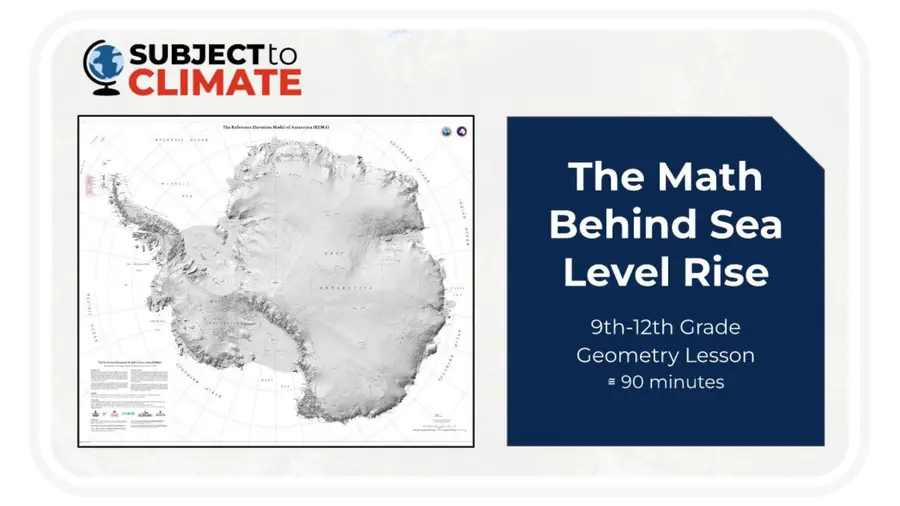
Geometry Lesson: Calculating Sea Level Rise
Grades 9–12 · Math · Lesson Plan
- INQUIRE: Ask how much seas rise if Antarctica melts
- INVESTIGATE: Estimate surface area, volume, and density; convert units and percents
- INSPIRE: Apply formulas to model glacial melt scenarios
Next Steps
✉ Want a new classroom-ready math lesson each month? Get our free newsletter.
Frequently asked questions
What do the early elementary lessons teach?
Go Fish! (K–2): share goldfish crackers equally using division and comparisons. How Does Your Garden Grow? (K–2): measure and compare plant growth in a classroom garden.
What do the upper elementary lessons cover?
Timber! (3–8): a forest game with addition, doubling, and line graphs. Count the Trees (3–5): greenhouse-gas word problems with multiplication and rounding. Earth: Apple of Our Eye (3–5): fractions of farmable land with an apple demo.
What middle school math is included?
Comparing Travel Emissions (6–8): NYC trip costs and emissions with rational numbers and equations. Climate Change Survey (6–8): design surveys and calculate percentages, plus pie and bar graphs.
What high school math is included?
Thermal Expansion (9–12): algebra, cylinder volume, and graph reading from video pauses. Plotting Trends (9–12): Chicago scatterplots and trend lines with real data. Geometry of Sea Level Rise (9–12): geometry of Antarctic melt.
Where can teachers find more math resources?
The SubjectToClimate database and math-filtered resources linked at the end, plus the newsletter for new lesson plans and insights.
Are these resources really free?
Yes. All SubjectToClimate math lessons and activities are free for educational use with proper attribution to the content provider.
About the authors
Meet the educators behind the featured resources in this guide.

Emily Rogers
Chief Content Officer, SubjectToClimate
Emily Rogers, MLIS, is SubjectToClimate's Chief Content Officer. She holds a bachelor's degree in English and French and a master's degree in library and information science. She spent seven years teaching information evaluation and research skills as a school librarian in K-8 public schools. As a lifelong resident of Southern Louisiana, Emily has a particular interest in how climate change affects coastal regions.
View Profile ➜
Julie
Math Educator, SubjectToClimate
Julie was a high school math educator for the last 5 years. She believes that climate change education can empower communities to take action and demand justice at the top. She is excited to combine her experience in education, user experience research, and human-centered design to propel SubjectToClimate's mission.
View Profile ➜